


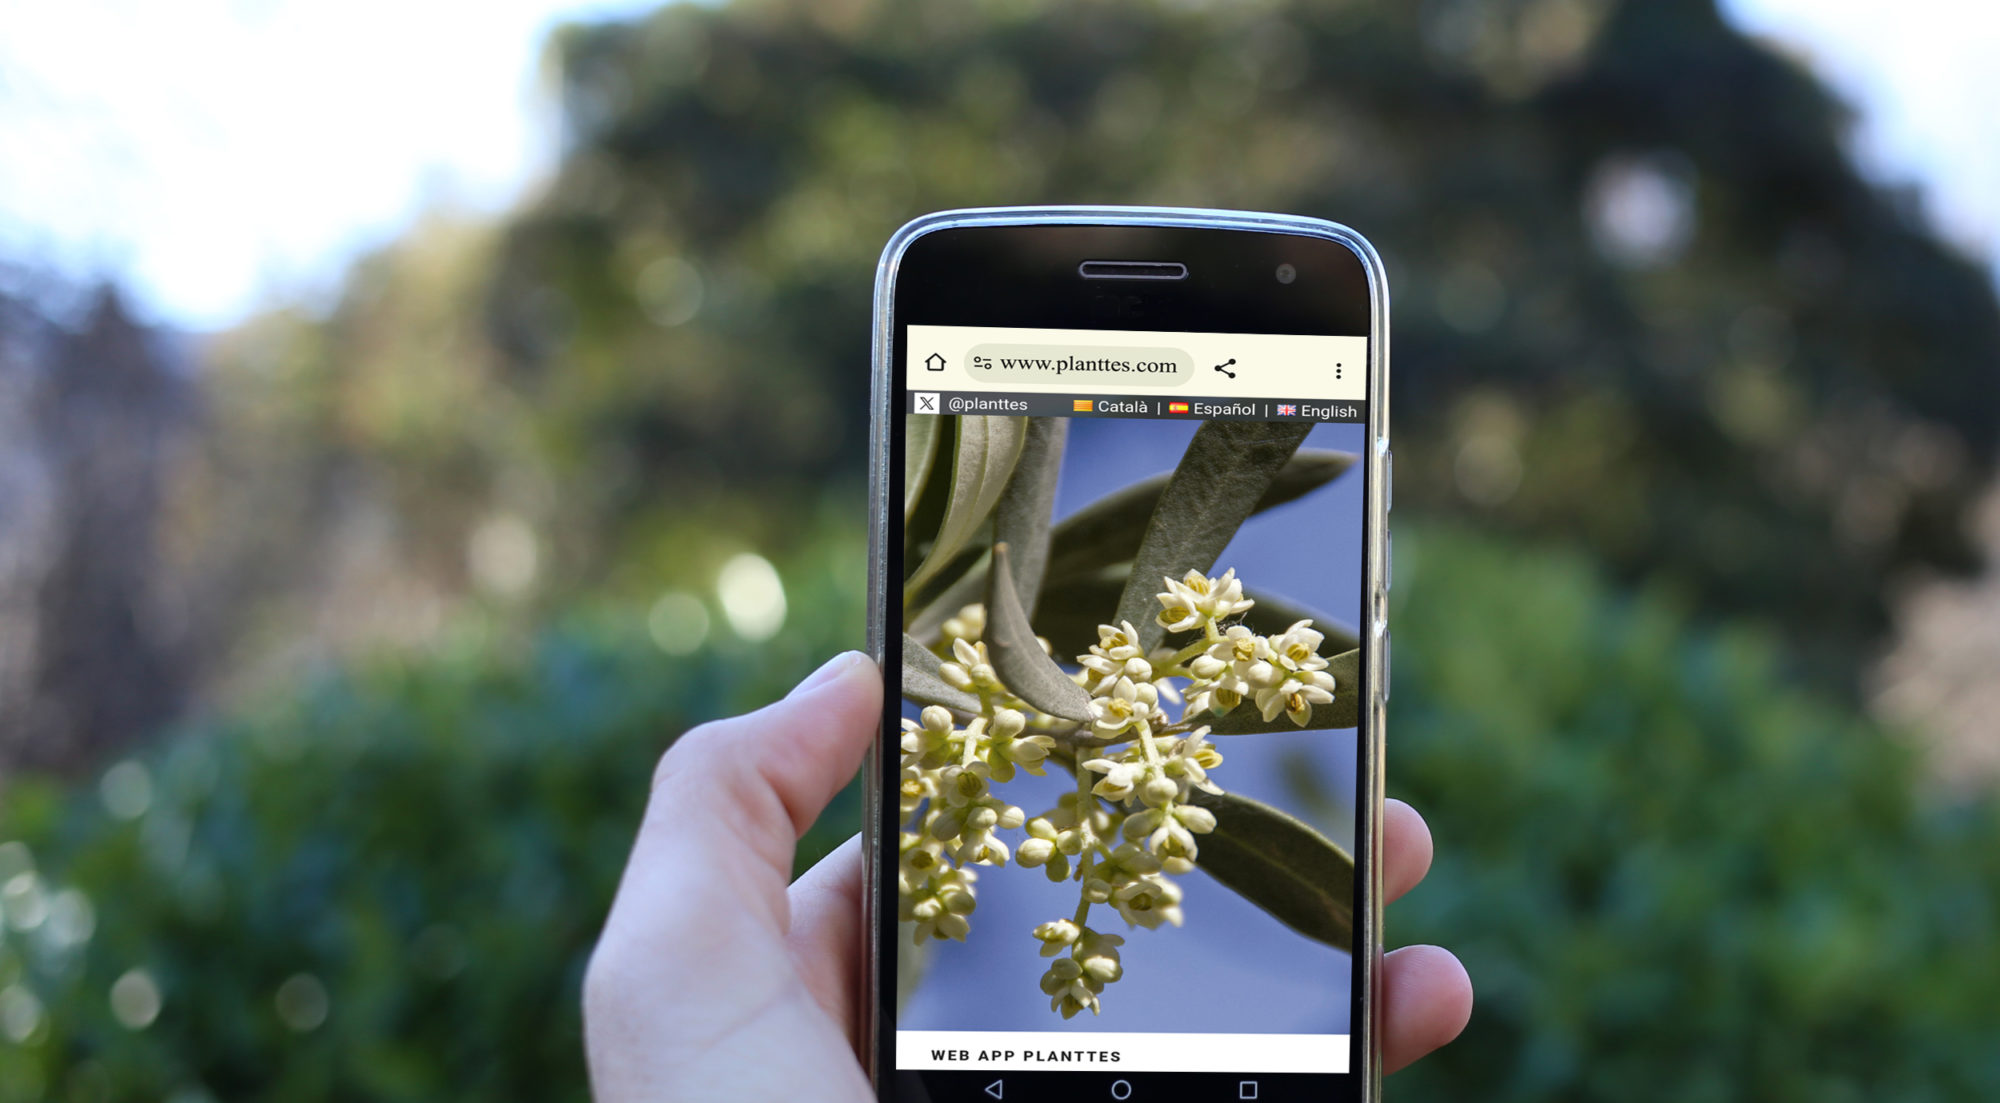


Planttes Web App is a citizen science tool where the users identify and locate the presence of allergenic plants on the map and indicate their phenological status.
To do this, Planttes Web App works with images of the 11 most important allergenic plants in the Mediterranean region. It offers them information on what their flowers and fruits look like. The system allows the user to indicate on the map the point where they are located (geolocation), what plant they are looking at, and if it is without a flower, in the flower formation phase, if it has an open flower or if it already has fruit. To create a new record, the user must take a photo of the plant where its phenological state can be observed (detailed photo of the flower/fruit).
The contributions created in the Web App are reflected on a map that can be viewed by other users and can help them decide the most recommended itinerary to follow in the urban environment to avoid as much as possible proximity to those places where the plant that causes allergy.
The contributions that are made to the Web App are shown on a map. By accessing the pop-up of each record you see the photo of the plant, together with the date of publication and the phenological data that have determined the allergenic risk.
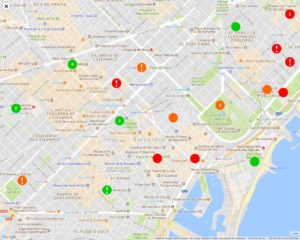
This is dynamic information, which changes day by day, in the same way that plants do. The degree of risk is classified into three categories (low risk, increasing risk and maximum risk) and represented by markers with green, yellow and red colors in the following way:

The filters provided in the map allow you to select the specific plant or groups of plants of your interest, so that you can create your personalized risk maps. In this way, you will be able to be save from allergy episodes by avoiding the visit of the most risky areas.
Sometimes the map will show the message “Actualize record”, indicating that the phenological phase of the plant should be update. Here your participation is fundamental: visit the plant and update its state, and so you help us to maintain the map up to date!
 On the other hand, in the map you can see the phenological changes registered to each plant by selecting its identifier (ID_plantes) in the web-map filters. With this, you can observe how the plant changes its state and if it always does so in the same periods year after year, or if it changes.

Behind Planttes there is a scientific community that validates the contributions of the users.